Apache Superset: Test driving a new tool with familiar metrics
For years, I have been using a piece of software by the name of Spotfire, Tibco Spotfire to be more specific. The software
falls into the category of what is referred to these days as BI or Business Intelligence software ![]() . While I was never
a huge proponent of Spotfire because there were limitations on what it could do, I was still pretty decent at embedding R & SQL,
creating templates and ultimately deploying the dxp files to the web (via WebPlayer). Spotfire is proprietary and licensing can cost big money, so
I used it at work and work alone.
. While I was never
a huge proponent of Spotfire because there were limitations on what it could do, I was still pretty decent at embedding R & SQL,
creating templates and ultimately deploying the dxp files to the web (via WebPlayer). Spotfire is proprietary and licensing can cost big money, so
I used it at work and work alone.
![]() I trained many engineers at my previous employer in SQL, R, Python, Linux, etc.. But, the request I received most
often, was can I train them on getting the most out of Spotfire. In fact my final few months, I was giving Spotfire trainings
to various groups multiple times a week. Given that these business intelligence tools are becoming common place at most
companies and that they allow people who do not necessarily nerd out on application and web developement, the capability
to create their own reports or data-driven applications with relative ease… Why not spend some time to explore a relatively
new Open Source BI tool by the name of Apache Superset?
I trained many engineers at my previous employer in SQL, R, Python, Linux, etc.. But, the request I received most
often, was can I train them on getting the most out of Spotfire. In fact my final few months, I was giving Spotfire trainings
to various groups multiple times a week. Given that these business intelligence tools are becoming common place at most
companies and that they allow people who do not necessarily nerd out on application and web developement, the capability
to create their own reports or data-driven applications with relative ease… Why not spend some time to explore a relatively
new Open Source BI tool by the name of Apache Superset?
Superset: Install and test drive
Installation
According to the Apache Superset documentation found here, there are two ways to install Superset (at least for Linux):
- Using docker-compose
- Using pip
I began by testing the software using the docker-compose install. The install was very straightforward and I was able to login using admin/admin as my username and password. After logging in I was able to connect to a local instance of PostgreSQL without any issue. Before getting too carried away, I decided to logout and stop and remove the containers before firing the containers immediately back up. I am happy I did beause I was greeted with an error and could not for the life of me, restart the containers. So, onto using pip in a virtual environment (option 2 above).
I used the following steps to install Superset with pip:
- Installed OS dependencies:
sudo apt-get install build-essential libssl-dev libffi-dev python3-dev python3-pip libsasl2-dev libldap2-dev - Created an empty directory for my virtual environment and superset:
mkdir superset - Changed directories into that empty directory:
cd superset - Created the python virtual environment:
python3 -m venv venv - Activated the virtual environment:
. venv/bin/activate - Installed Apache Superset:
pip install apache-superset - Created username and set password:
superset fab create-admin - Created roles and permissions:
superset init - Installed psycopg2 since I am connecting to a PostgreSQL database:
pip install psycopg2 - Finally, started the flask development web server:
superset run -p 8088 --with-threads --reload --debugger
After performing the above steps, I was able to open my web browser on my localhost at port 8088 and login to
Apache Superset. Connecting to my PostgreSQL database server was very easy. I selected Data on the tap nav bar and
Databases from the dropdown. Once on the database page, I selected the + DATABASE button in the upper right hand
side of the page opening this menu ![]() :
:
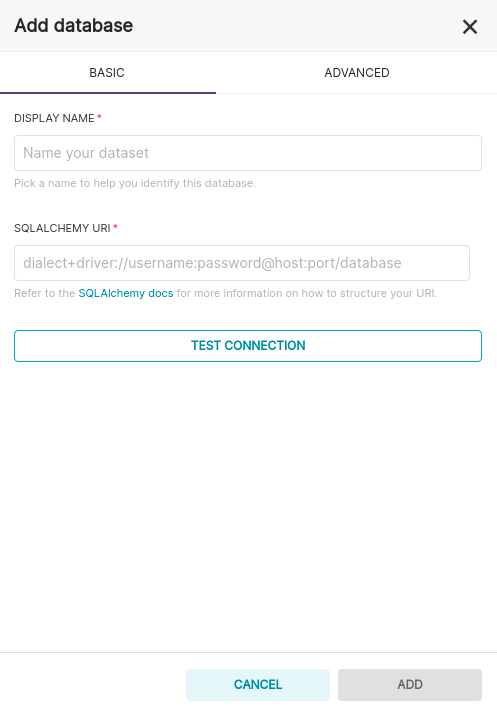
The display name can be anything you really want, I would suggest something that describes the type of data stored in the database you are connecting to. My connection string for my PostgreSQL database looks like this:
postgresql+psycopg2://soitgoes511:XXXXXXXXXX@192.168.0.12:5432/pulse_oximeter_historic
If you believe you will ever upload CSV files for analysis, this is where you configure that. Go to ADVANCED -> Other -> toggle Allow data upload. If you have selected this option and upload a CSV file, that CSV file will be loaded as a table into the database you just created the connection for.
After completing the above steps, I quickly faced an issue. Despite being able to connect to my database succesfully, when attempting a simple query, I was greeted with the below error:
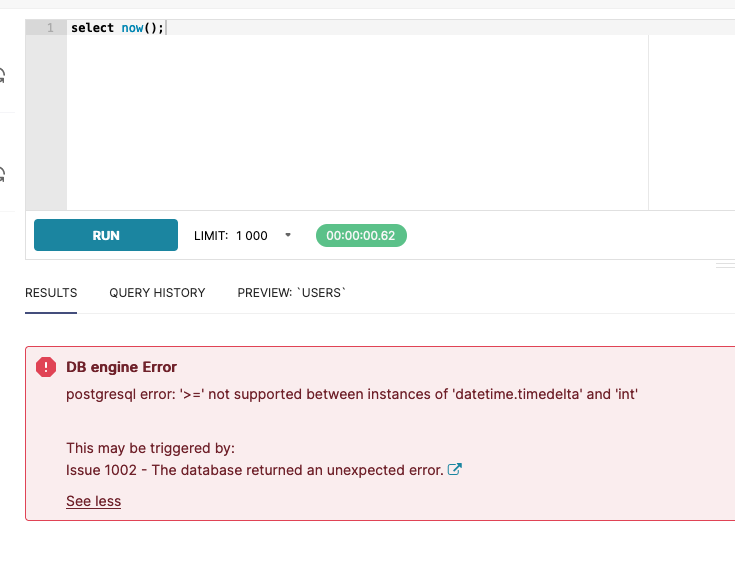
There is still an open issue on Github concerning the error above.
Long story short, the error is appearing due to a timestamped column and more specifically, a timestamped column
containing an offset. To head off any headaches, if you see this error, check your psycopg2 version. Myself as
well as at least one other individual had version 2.9.1 installed and downgrading to psycopg2==2.8.6 made the error
go away. ![]()
Now that Apache Superset is installed, my database is connected and the error is gone, I can move forward with creating datasets, charts and dashboards.
Creating a dataset
The entire spirit of business intelligence tools is to explore data, look for insights and hopefully solve some good problems. Once you have the story you would like to tell laid out on a dashboard, you can share this with your colleagues. On the job, I have made it a habit of trying to condense all of my biggest care abouts down to two or three views or dashboards. If there were certain data points co-workers or managers would ask for often, I made sure that was on one of my dashboards. This allowed me to identify issues, near real time, and be reactive. This also freed up my time to dig into new interesting problems. Some people like the mindless task of spending hours, manually compiling their data and reports, I prefer to automate it.
So, to create these dashboards, we need data. Superset will allow you to import CSV files or query the database we have already connected to. Since I enjoy SQL, and have some data I would like to review stored in my PostgreSQL db, I will walk through querying my a PostgreSQL database in Superset via SQL Lab and then saving that dataset and query.
The first step is to select SQL Lab on the top nav bar, and from the dropdown, select SQL Editor. You will see this, but without the query and return values:
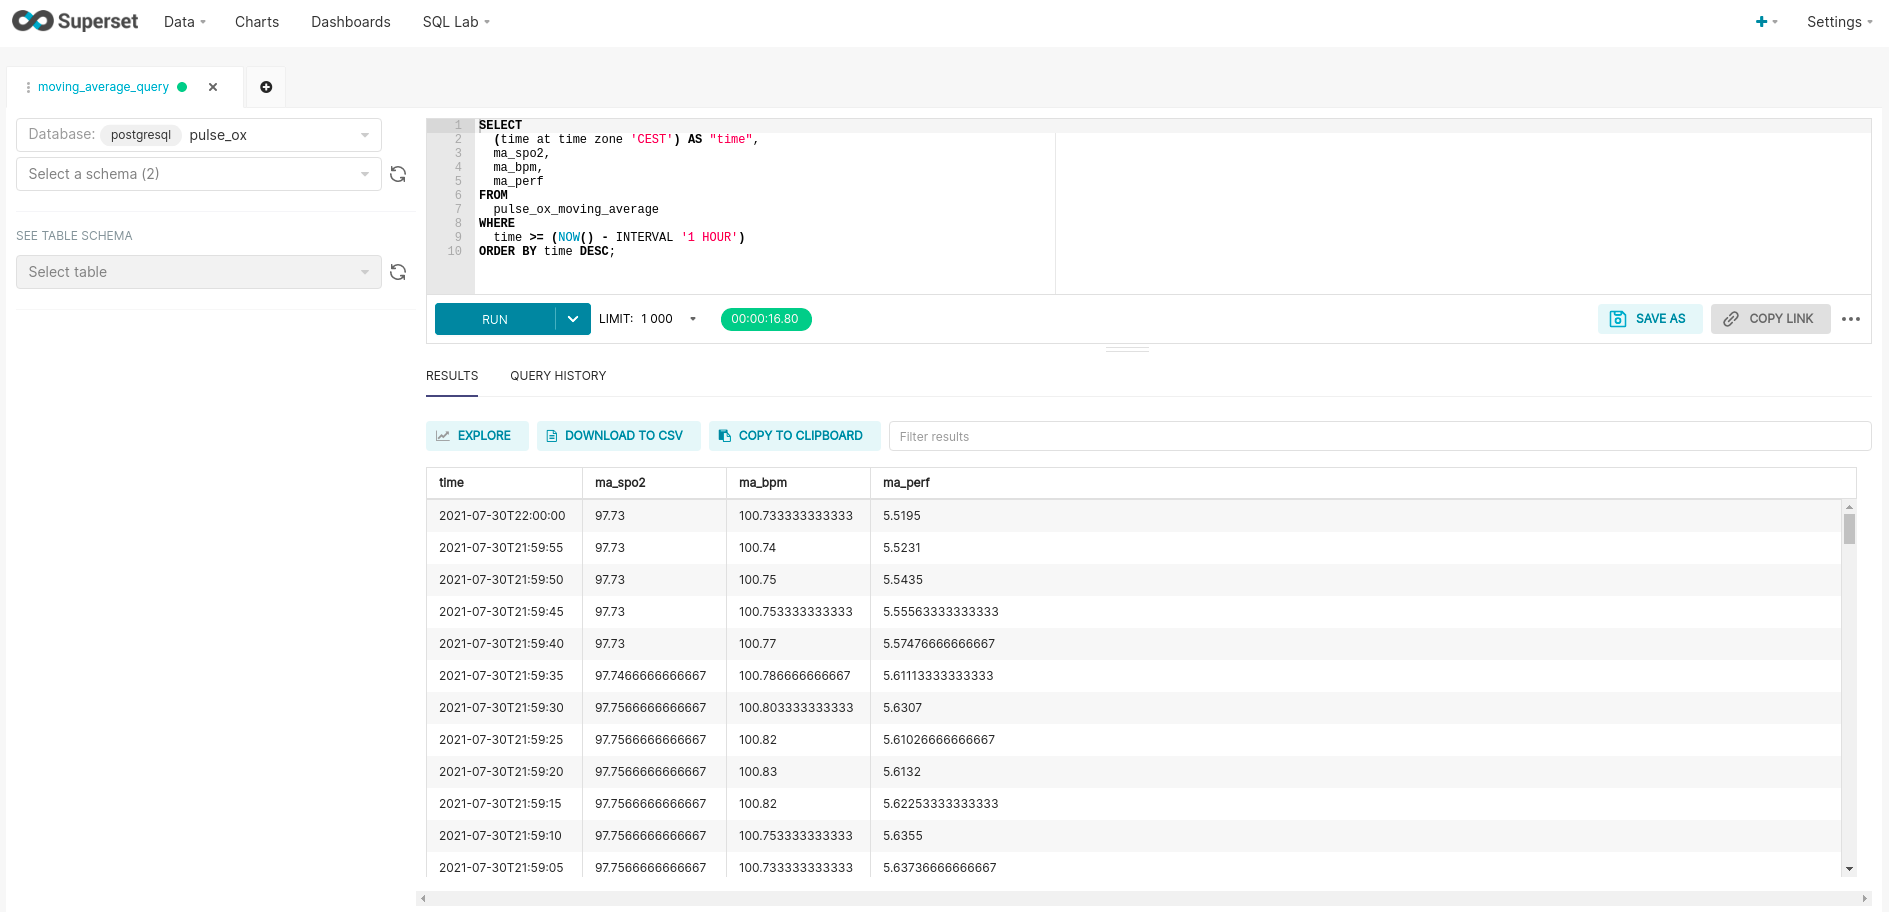
Please note, that you select the database connection you would like to use in the upper left hand corner (pulse_ox in my case). Once I entered the query seen below, I can hit ctrl+enter to sanity check and review the data. Here is a closer look at my query shown in the screenshot:
SELECT
  (time at TIME ZONE 'CEST') AS "time",
  ma_spo2,
  ma_bpm,
  ma_perf
FROM
  pulse_ox_moving_average
WHERE
  time >= (NOW() - INTERVAL '1 hour')
ORDER BY time DESC;
Now, before I save this query and the dataset, I will remove the WHERE and ORDER BY clauses. I do not want to filter the data in the dataset or underlying query but with a filter on the dashboard. I also do not want to order the dataset since all it will do is waste compute time and is unnecessary. Also note that I am converting my time to Central European Summer Time. I have the timestamps stored as UTC in my postgres instance and would like to review the traces in my local timezone.
To save the query for later use or fine-tuning, select the blue SAVE button under the text box. To save the dataset and begin charting, select the blue EXPLORE button directly above the return results. Once named and saved, a new EXPLORE tab will be opened in the brower, and I can begin building my charts.
Creating charts and filters
Creating charts is fairly straight forward. There are a multitude of chart types to choose from:
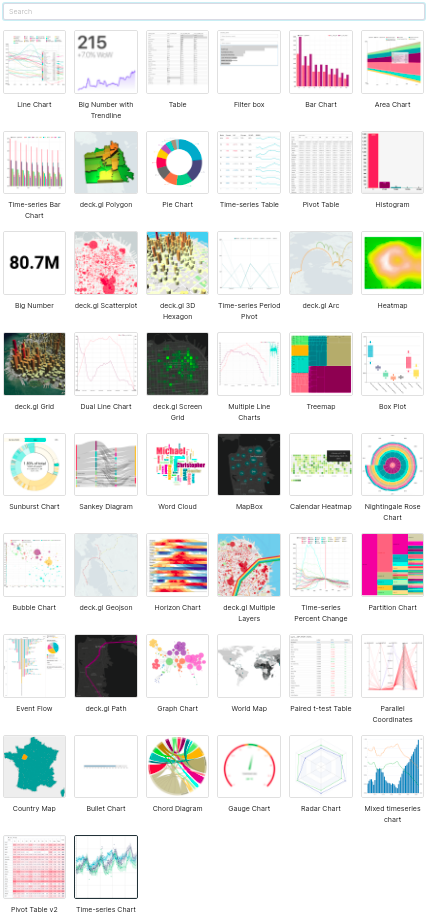
I have not experimented with them all but I have with most. Since my data is time-series data, I will choose the time-series chart type (last chart in the above assortment). This chart type does not have the ability to use a left and a right y-axis, but I can create multiple traces on the same plot which share the same y-axis. Here is my first attempt of a chart:
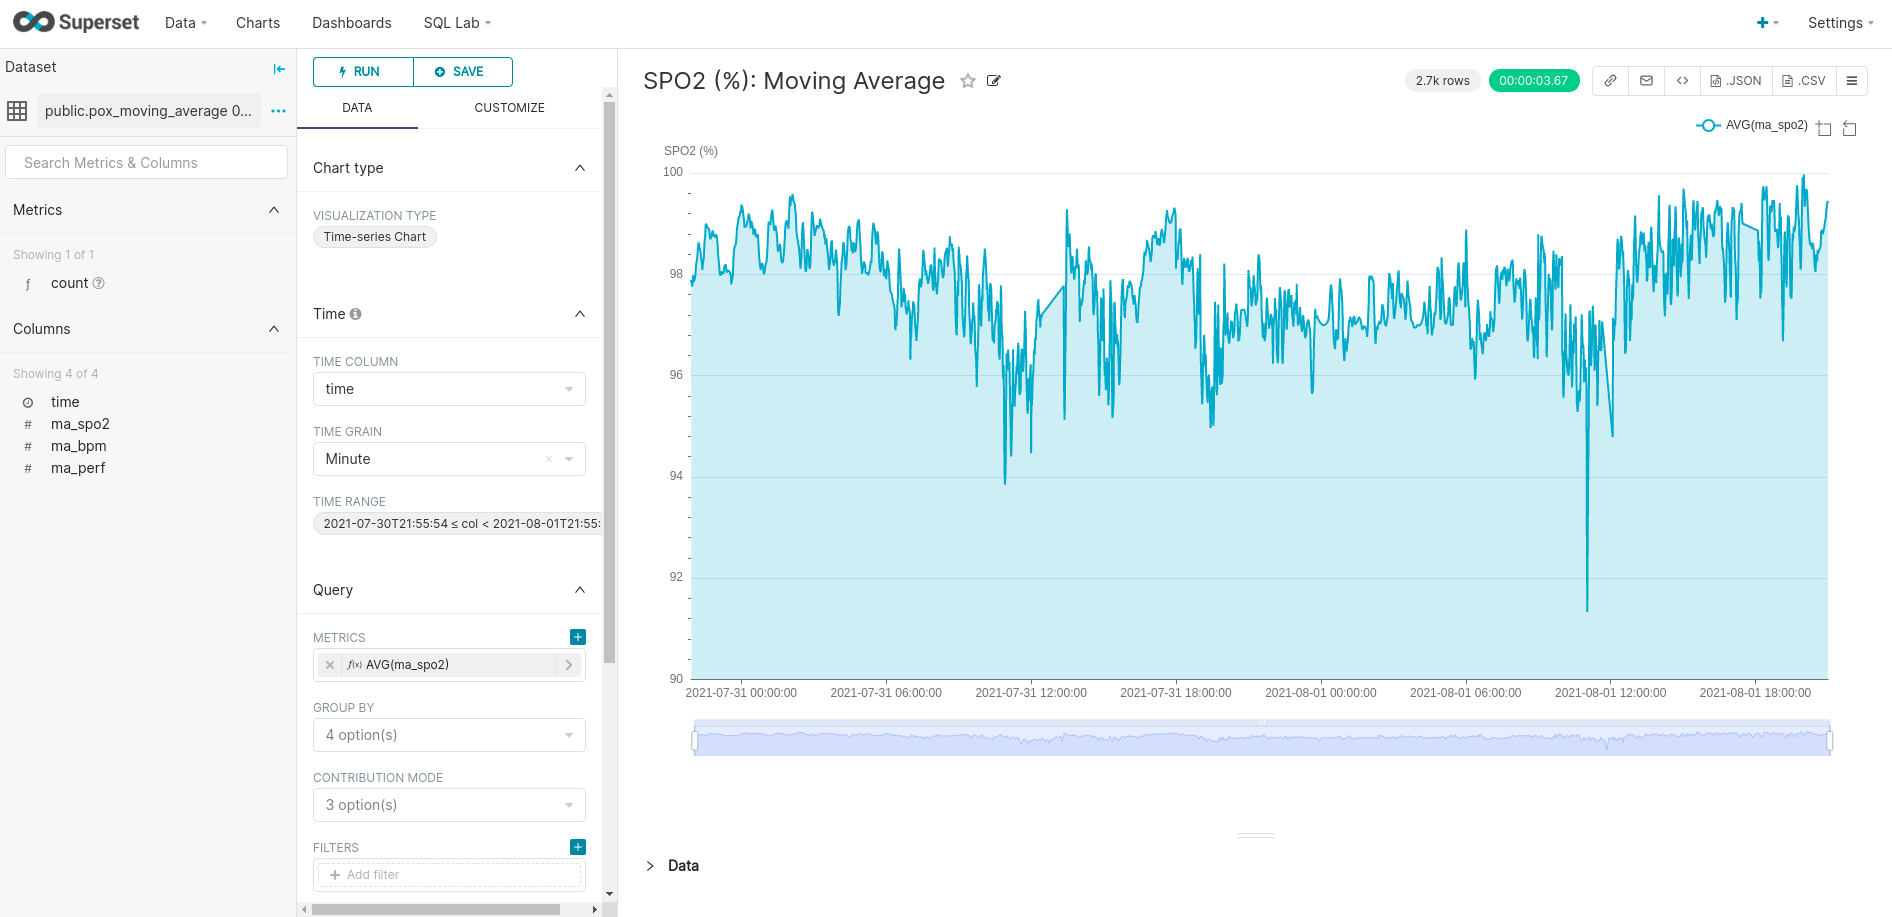
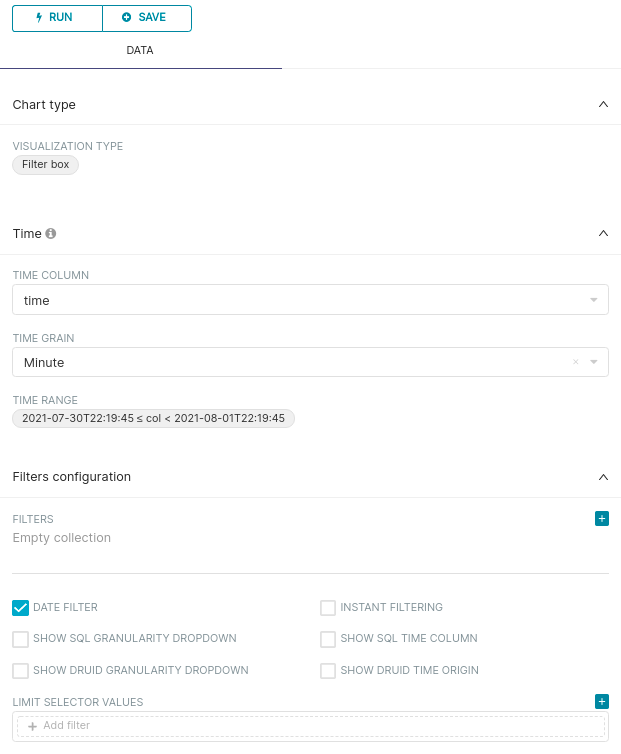
When creating a dashboard in Superset, you choose from your already created and available charts and/or filters. So, I will go ahead and create a simple time range filter and some more charts before I move forward with my dashboard. Here is a simple filter (found as a chart type):
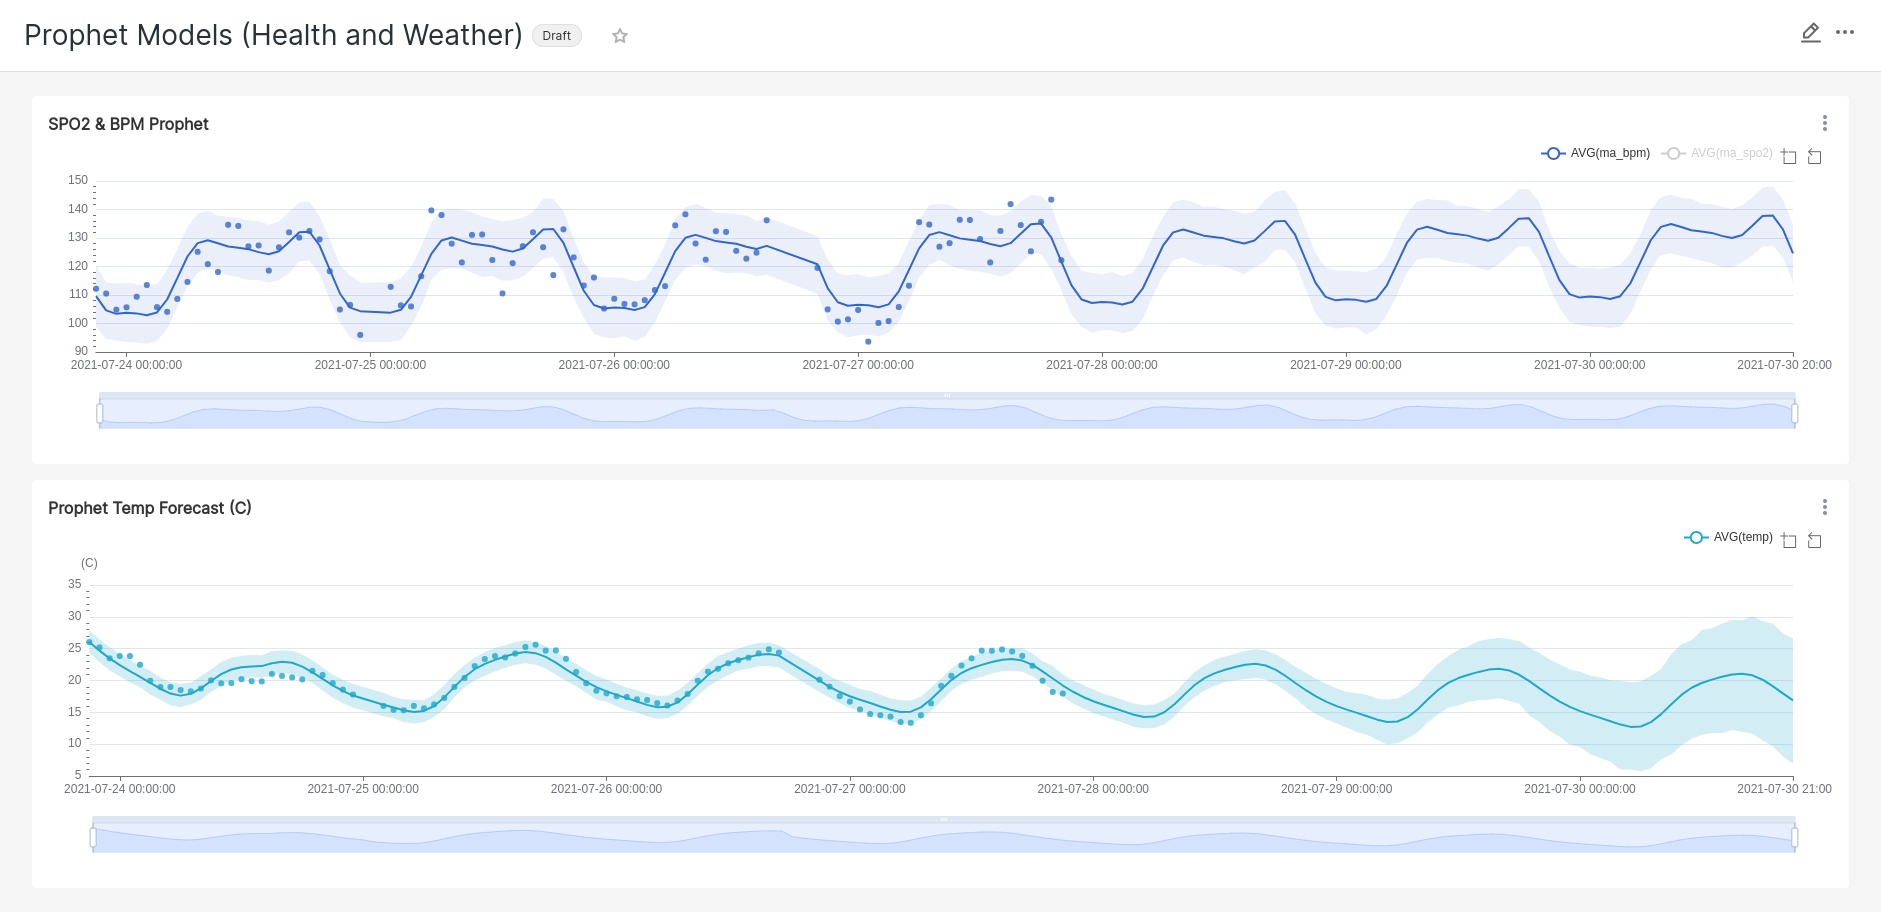
I am even able to build forecasting into a chart using Prophet. The component plots are not available, but designating my confidence interval, daily, weekly and yearly seasonality is available. To utilize this feature, you must install pystan and prophet:
- pip –no-cache-dir install pystan==2.19.1.1
- pip install prophet
As of this post, pystan >= version 3.0 will not work, hence me specifying version 2.19.1.1 above.

Putting it all together into a dashboard
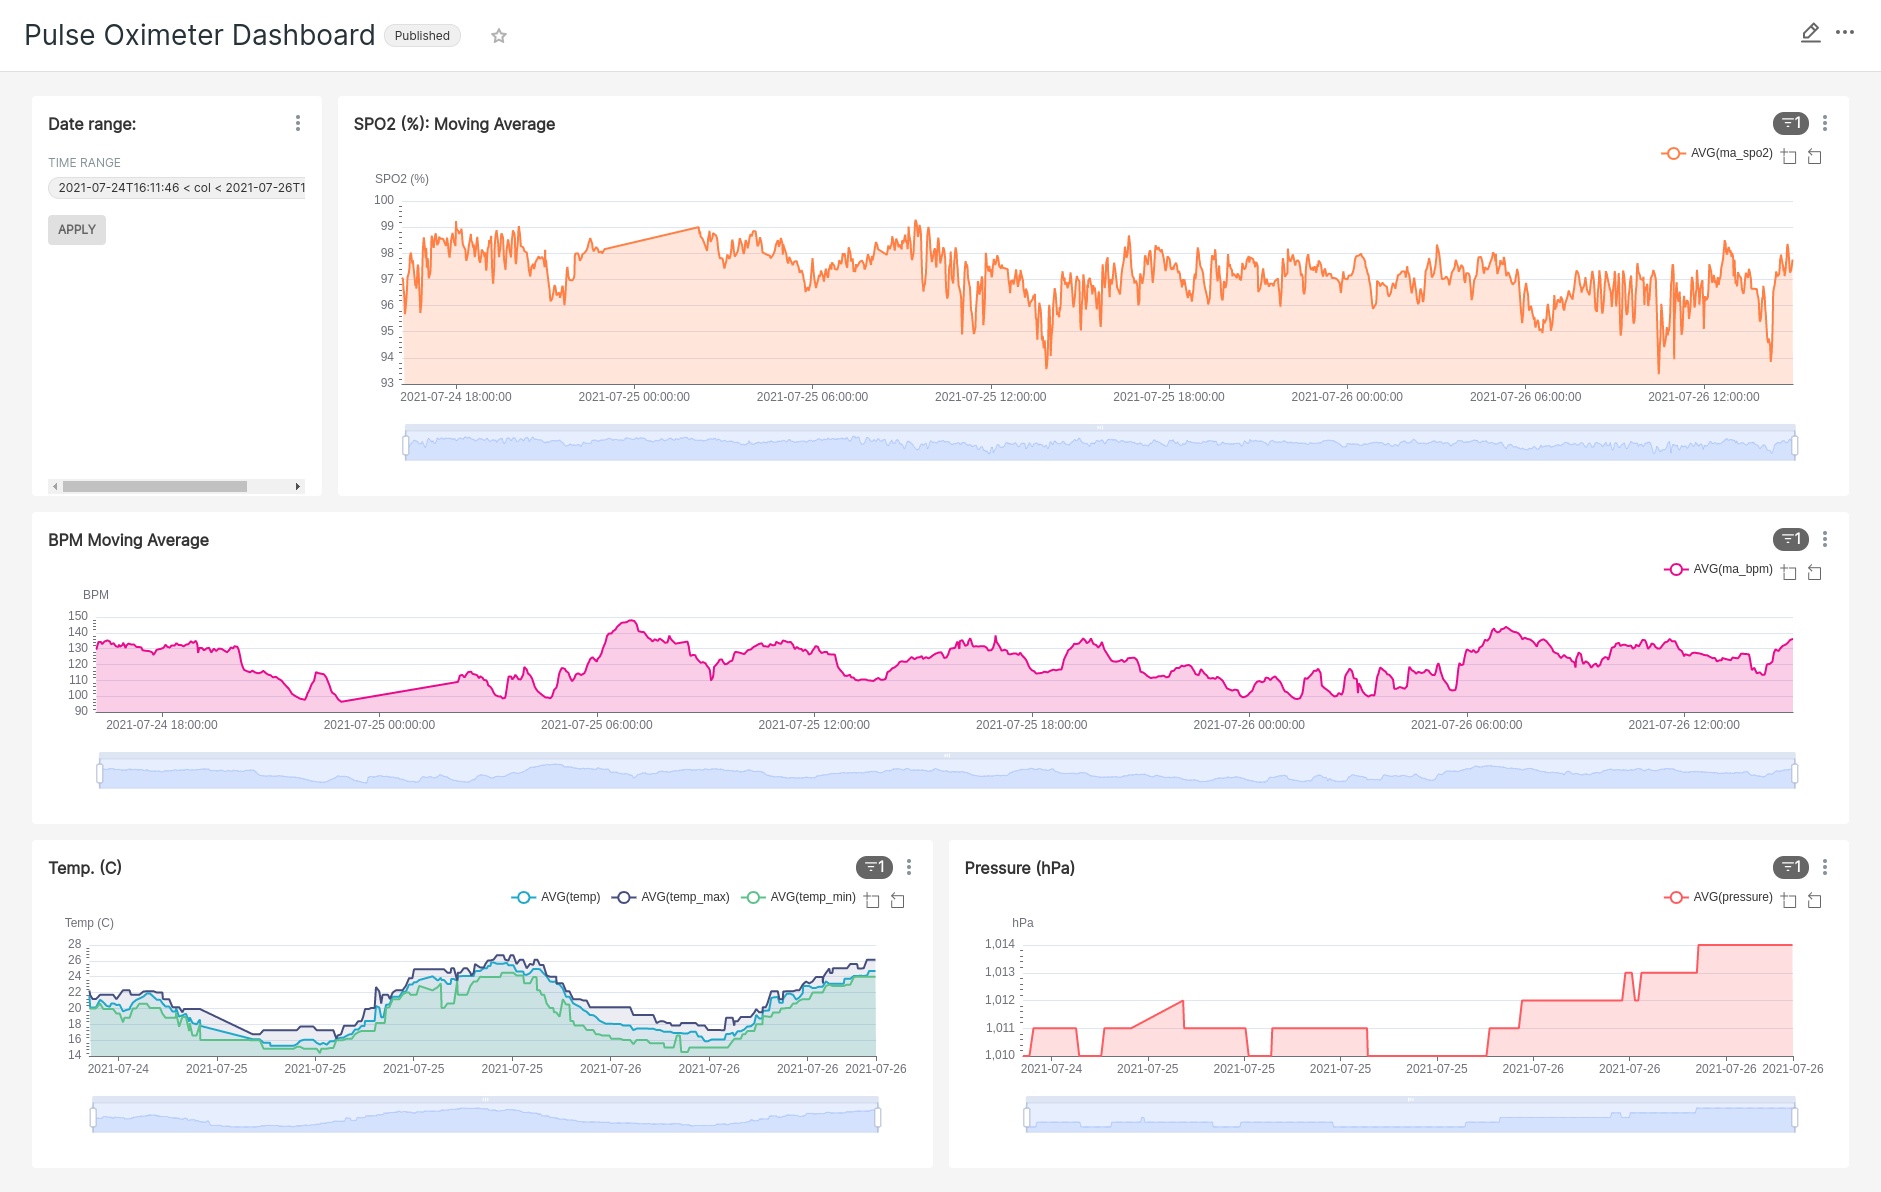
Once all of the charts and filters have been created, it is time to construct a dashboard. Don’t fret if something needs tweaked further down the road, all you have to do is update the chart and the dashboard (assuming it contains the chart) will reflect the updates.
Closing comments
I mentioned Spotfire at the beginning of this post, so, after walking through creating datasets, charts and dashboards with Apache Superset I should mention a few glaring differences between the two BI tools.
- Spotfire is proprietary and Superset is open source
- I commonly used R to wrangle and transform data in Spotfire as a Data Function, Superset allowed for only SQL (easier but limiting)
- Spotfire could run as a free standing desktop application on my PC or be deployed to the web and accessed via Webplayer. Superset runs as a standalone server on some system. I have seen individuals deploying Superset to Heroku.
- There were more chart types available for Superset but some of the charts I have had difficulty using (Multiple Line Charts specifically). Superset is still relatively new and I have faith that some of the bugs will be worked out soon.
- Errors are easier to interpret (IMHO) in Superset than Spotfire. I don’t know how many times I had some hidden whitespace character in my Spotfire Data Function that was preventing my function from executing. The errors would yield zero valuable insight.
There are many facets of Apache Superset I did not delve into (users, roles, annotations and layers, deploying on a production server, etc…). The primary motivation for this post was to show that good business intelligence tools are available to use for free, and can help you gain insight into whatever data you are attempting to put under a microscope. Why not take advantage of them if the need arises?
“There was nowhere to go but everywhere, so just keep on rolling under the stars.” ― Jack Kerouac, On the Road: the Original Scroll

Comments