
An untapped data source: Grafana Loki and Promtail
Motivation
For years, I have been using numerous different databases on an almost daily basis. Oracle, PostgreSQL, MariaDB, InfluxDB, etc.. etc.. I enjoy the challenge of writing complex queries and discovering patterns or trends in the results. I believe that most individuals in a business setting should be familiar with SQL (though this is far from reality). I am also well aware that databases are not the only place that data can be extracted. Some other data sources include:
- Web scraping
- Flat files (excel, csv, json)
- Logs
I am familiar wth all the sources named in this list with the exception of logs. Have I looked at or seen logs? Of course I have. I still refer to my dmesg log if I have a file system or device mounting issue. I have used numerous apache/httpd logs to troubleshoot WSGI applications. But, both of these cases have never merited me learning to use something like a log aggregator. Until now. For the first time in my professional career, I have found the need to extract log data which is not available anywhere else except in a mountain of logs. More specifically, logs generated by automation systems. Since I have read about various solutions for successfully analyzing log data in the past, I have decided to use this opportunity to test drive one of these solutions. I will not be using the automation logs already mentioned above for this post, but I will be using various sytems logs to better understand the tooling and log aggregate capabilities in general.
Grafana Loki
Loki is a log aggregation system, inspired by Prometheus, which was started in 2018 by Grafana labs. I will be using the local install (non-Docker on bare metal), version 2.7.1. I am not going to run through the install process. In short, the Loki archive came with a single binary included. A configuration file is required to indicate the desired location for stored data, the listening port number, etc.. The installation process is relatively straightforward and the only issues encountered were due to improper permissions. I have included my configuration file which I am using for my test drive below.
Loki configuration file used
auth_enabled: false

server:
  http_listen_port: 3100
  grpc_listen_port: 9096

common:
  path_prefix: /tmp/loki
  storage:
    filesystem:
      chunks_directory: /tmp/loki/chunks
      rules_directory: /tmp/loki/rules
  replication_factor: 1
  ring:
    instance_addr: 127.0.0.1
    kvstore:
      store: inmemory

schema_config:
  configs:
    - from: 2020-10-24
      store: boltdb-shipper
      object_store: filesystem
      schema: v11
      index:
        prefix: index_
        period: 24h

limits_config:
  max_query_length: 0h

query_scheduler:
  max_outstanding_requests_per_tenant: 4096

frontend:
  max_outstanding_per_tenant: 4096

ruler:
  alertmanager_url: http://localhost:9093

analytics:
  reporting_enabled: false
I have also created a service file to start the Loki daemon quickly without the need to remember how to source the configuration file. I am including this as a reference for myself and any reader who stumbles upon this post who uses systemd.
[Unit]
Description=Loki service
After=network.target

[Service]
Type=simple
User=loki
ExecStart=/usr/local/bin/loki-linux-amd64 -config.file /usr/local/bin/loki-local-config.yaml

[Install]
WantedBy=multi-user.target
So, now that I have Loki downloaded, configured and running, I need to start sending some log streams to the Loki api. To accomplish this task I will be using Promtail. The next section will briefly cover Promtail and also include the configuration and service file.
Promtail
Promtail should be installed on any system containing logs. Promtail runs as a background service and will monitor the log files and extract any newly appended log entries from those log files. Once extracted the log entries will be labled and pushed to the Loki server which is actively listening (at port 3100 according to the configuration file above).
Promtail configuration file used
server:
  http_listen_port: 9080
  grpc_listen_port: 0

positions:
  filename: /tmp/positions.yaml

clients:
  - url: http://localhost:3100/loki/api/v1/push

scrape_configs:
- job_name: system
  static_configs:
  - targets:
      - localhost
    labels:
      job: varlogs
      __path__: /var/log/*log
- job_name: apache
  static_configs:
  - targets:
     - localhost
    labels:
      job: apache
      __path__: /var/log/apache2/access.log
…and the service file used to start the Promtail service daemon on my systemd system:
[Unit]
Description=Promtail service
After=network.target

[Service]
Type=simple
User=promtail
ExecStart=/usr/local/bin/promtail-linux-amd64 -config.file /usr/local/bin/promtail-local-config.yaml

[Install]
WantedBy=multi-user.target
I would like to mention now that the Promtail configuration file can be used to create labels (think of a label as something you might want to group by during aggregation) before the log stream is sent to the Loki listener. Reading some of the documentation initially, I was under the impression that this was how Loki should be used. As such, the simple configuration file shown above was loaded with pipelines containing some serious regular expressions to pre-process the logs. After much frustration and after reading a multitude of Grafana community posts, I have come to the realisation that creating Labels is best handled at query time. Too many labels leads to issues concerning series cardinality. It is also painful to test regex by continuously stopping and restarting the Promtail daemon (I am not a regex pro in all the flavors of regex that are used today, Loki and Promtail understand Go RE2 regex strings). I will discuss these points more later in the post.
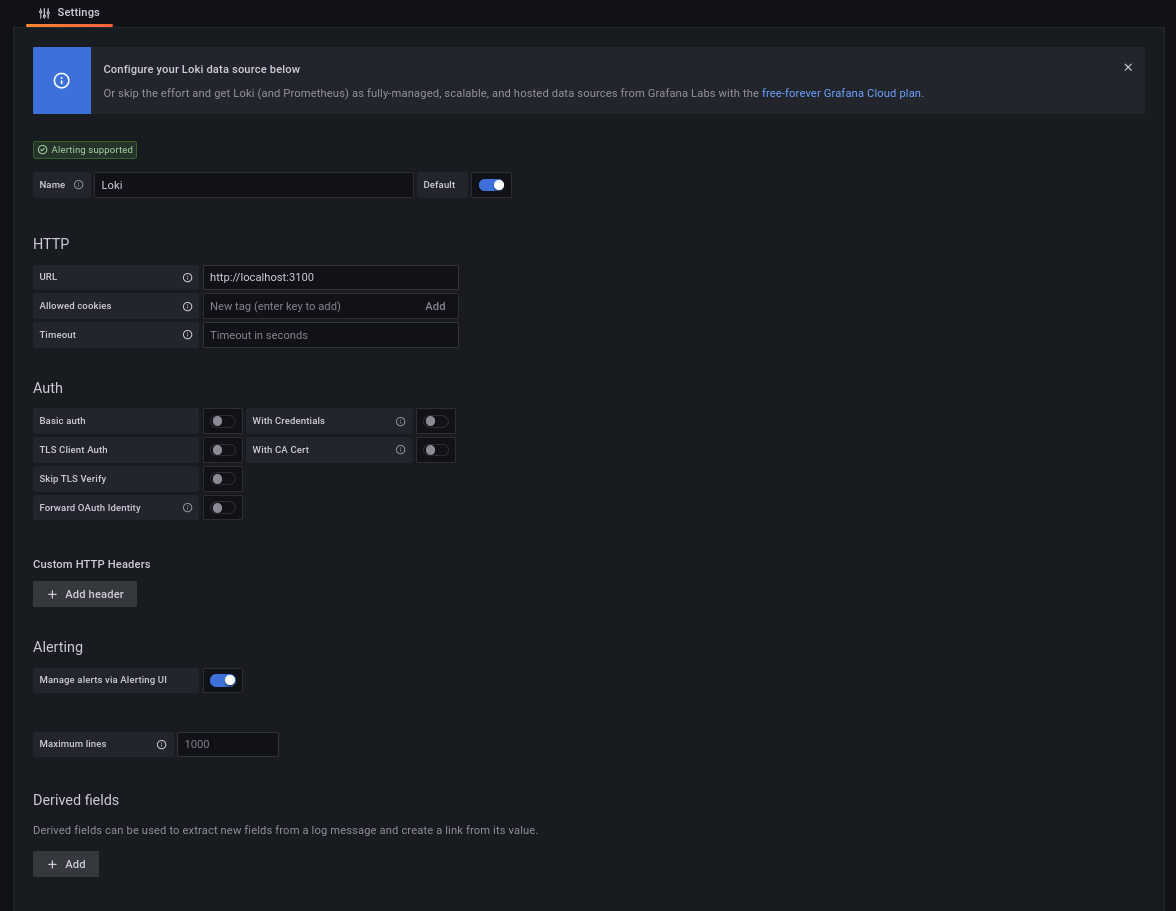
Connecting to Grafana
If you are familiar with Grafana, then you already know that the next step is to create a new data source, so I will do just that. For testing and for the purpose of this post, I am running Loki, Promtail and Grafana, all on the same computer. With this in mind, here is my new data source:
Next I will:
- Create a new dashboard
- Select the newly created Loki source as my data source
- Choose job under label filters
- Select apache which is the job name I gave the apache access.log in the Promtail config
- Generate a table to inspect how Loki is representing the log data
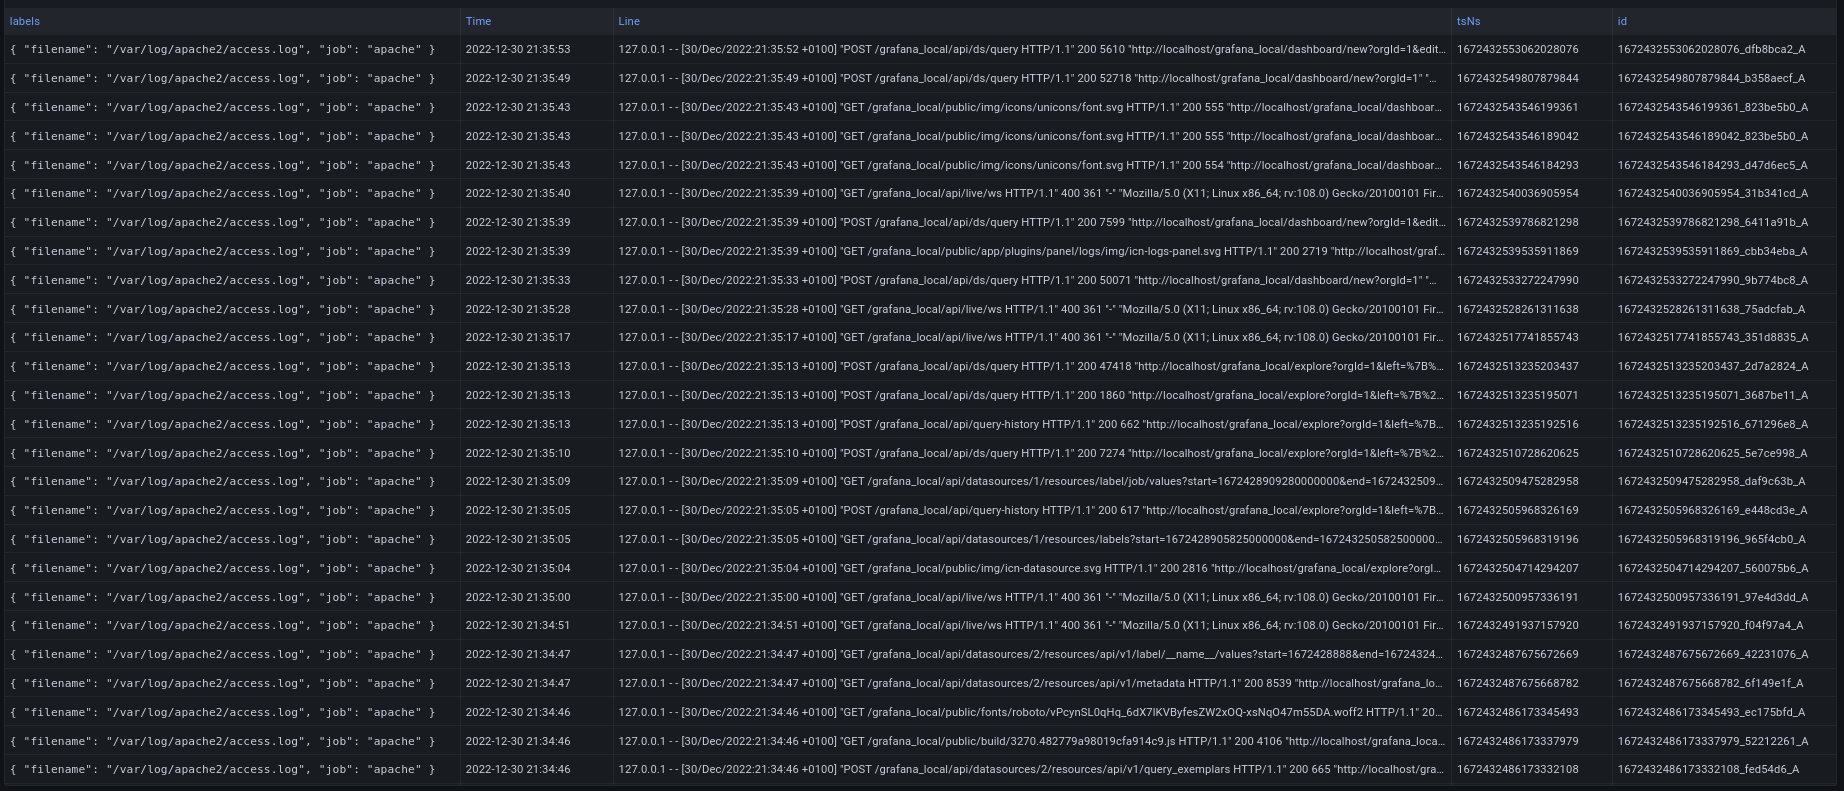
Grafana table panel output: apache2 access.log
Grafana log panel output: apache2 access.log
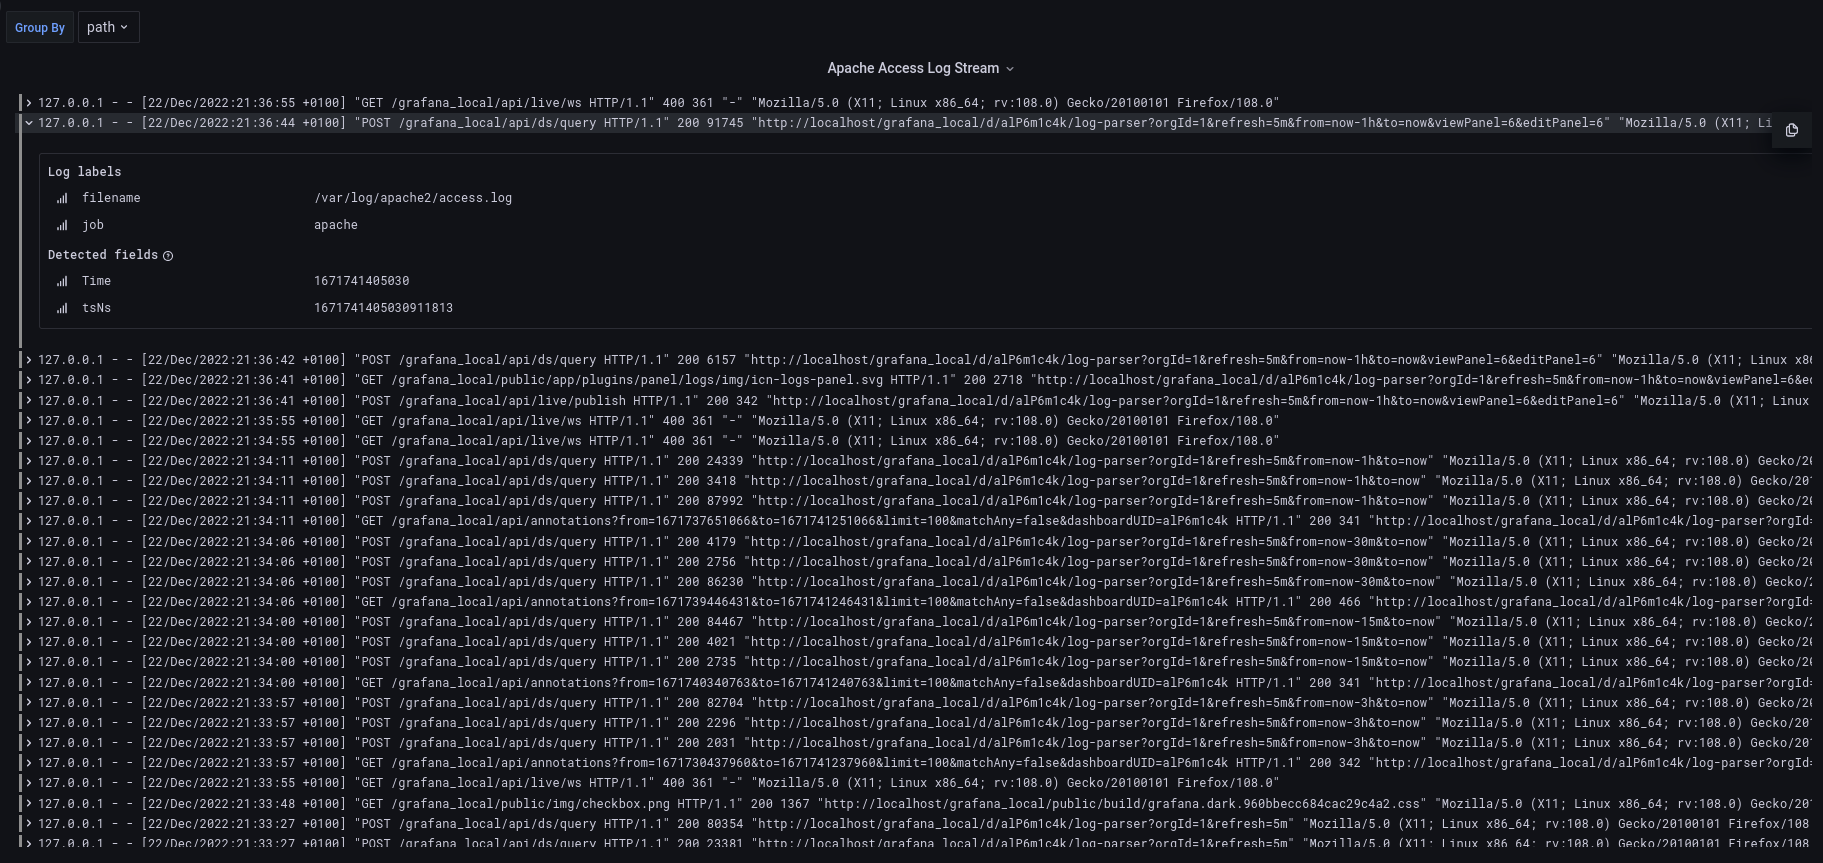
I chose the apache access log for testing because it is relatively straight forward. The log entries are recorded in a single line rather than on multiple lines. The various data fields expected are also repeated on each and every line of the log. Let’s take a look at a single log line and take a closer look at the fields:
127.0.0.1 - - [01/Jan/2023:21:33:40 +0100] "GET /grafana_local/api/search?dashboardUIDs=alP6m1c4k&limit=30 HTTP/1.1" 200 525 "http://localhost/grafana_local/?orgId=1" "Mozilla/5.0 (X11; Linux x86_64; rv:108.0) Gecko/20100101 Firefox/108.0"
- 127.0.0.1: Is the client making a request to the server
- - : Identity of the client making request (often just a hyphen)
- - : User ID of person requesting resource
- [01/Jan/2023:21:33:40 +0100]: Date and time of request
- “GET /grafana_local/api/search?dashboardUIDs=alP6m1c4k&limit=30 HTTP/1.1”: Request type and resource being requested
- 200: HTTP response status code
- 525: Size of object returned to client
- “http://localhost/grafana_local/?orgId=1”: This is the HTTP referer, which represents the address from which the request for the resource originated
- “Mozilla/5.0 (X11; Linux x86_64; rv:108.0) Gecko/20100101 Firefox/108.0”: This is the User Agent, which identifies information about the browser that the client is using to access the resource
Now, let us discuss the various fields returned by Loki with no transformations performed as of yet (output of Grafana table panel screenshot shown above). There are five columns:
- Column 1: Labels appended by Promtail in key-value pairs (currently filename & job)
- Column 2: The timestamp of when the log line was scraped by Promtail (I could use the timestamp from the log line itself by using the timestamp stage in the Promtail config pipeline, I chose not to for simplicity. I will include an example of this at the end of the post)
- Column 3: The log line in its’ entirety as seen in the apache access log
- Column 4: tsNs is the datetime stamp converted to epoch time with nanosecond precision
- Column 5: Unique id prepended with the epoch datetime stamp
Viewing the log entries in Grafana is great and all, but now the real fun begins. I would like to answer some basic questions about the data in the logs using Grafana Loki’s query language, LogQL. Yes, yes.. another, different query language, I know. Apparently, it is reminiscent of PromQL, so if you know PromQL, then you have a leg up on me.
LogQL: Exploring my access.log data
I am not going to spend a great deal of time discussing the nuances of LogQL. I am not an expert and there are plenty of documents available that will do the language more justice than I could. I simply want to discuss some of the basic concepts and point out some items I struggled with when initially writing a LogQL query. To begin, the one and only required arguement, you must have to make a valid query is a stream selector. Using the access log as an example (remember the job label apache was created in the Promtail config):
{job="apache"}
The above query is valid and will return the exact five columns I had shown in the screenshot above, with the same labels. I could retrieve the exact same data using the following query to select the access log by filename:
{filename="/var/log/apache2/access.log"}
With this basic log stream selected, I can begin filtering and transforming the log data to make some insights. For example, if I only cared about log lines containing the GET method, I could filter the log line like this:
{job="apache"} |= `GET`
The resulting data set would only contain the log lines containing a GET request. Effectively, this can be thought of like grepping a log file to only output the desired lines. Inversely, all log lines not containing the word GET can be returned too:
{job="apache"} != `GET`
Moving onto creating labels. I mentioned that from my limited experience, creating Labels at query time was the best path forward vs over-complicating the Promtail config file(s). There are multiple ways to do this and your choice will most likely be made based on the shape and format of your log files. Some of these ways include:
- Regex
- Pattern parsing
- JSON
- Logfmt
- Line format expressions
Due to the repeated structure of my access.log, I will be using the Pattern parser to create labels. I personally find this easier than using regex. Here is an example of creating a label out of every field containing data in my log:
{job="apache"} | pattern `<ip> - - [<dttm>] "<method> <resource> <protocol>" <status> <object_size> "<referer>" "<user_agent>"`
The labels generated by the above pattern parse statement are ip, dttm, method, etc.. I can now take these labels and begin to perform aggregations such as counting, summing, etc..
If you are not interested in making every single field into a label (which, if you are not actively using the labels, why would you), you can use an underscore to leave out the don’t cares. Below, only the ip field will be labeled:
{job="apache"} | pattern `<ip> - - [<_>] "<_> <_> <_>" <_> <_> "<_>" "<_>"`
Grafana includes a cool feature which explains how your log line transformation pipeline (query) will work:
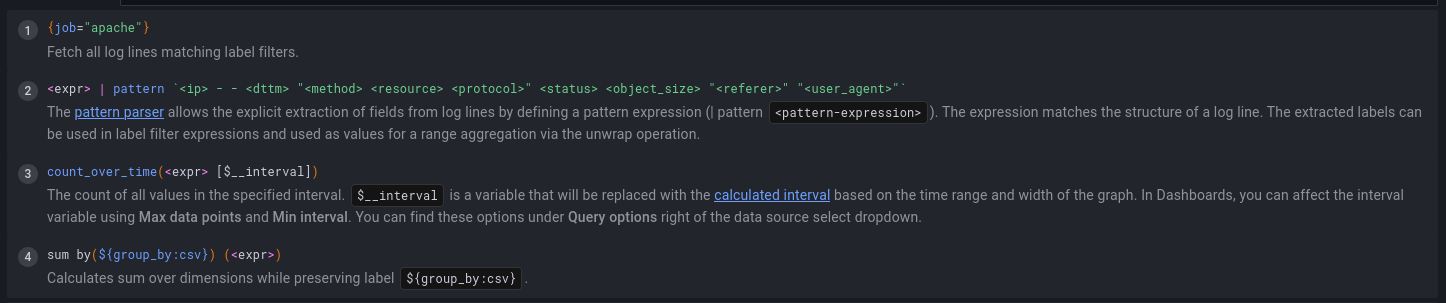
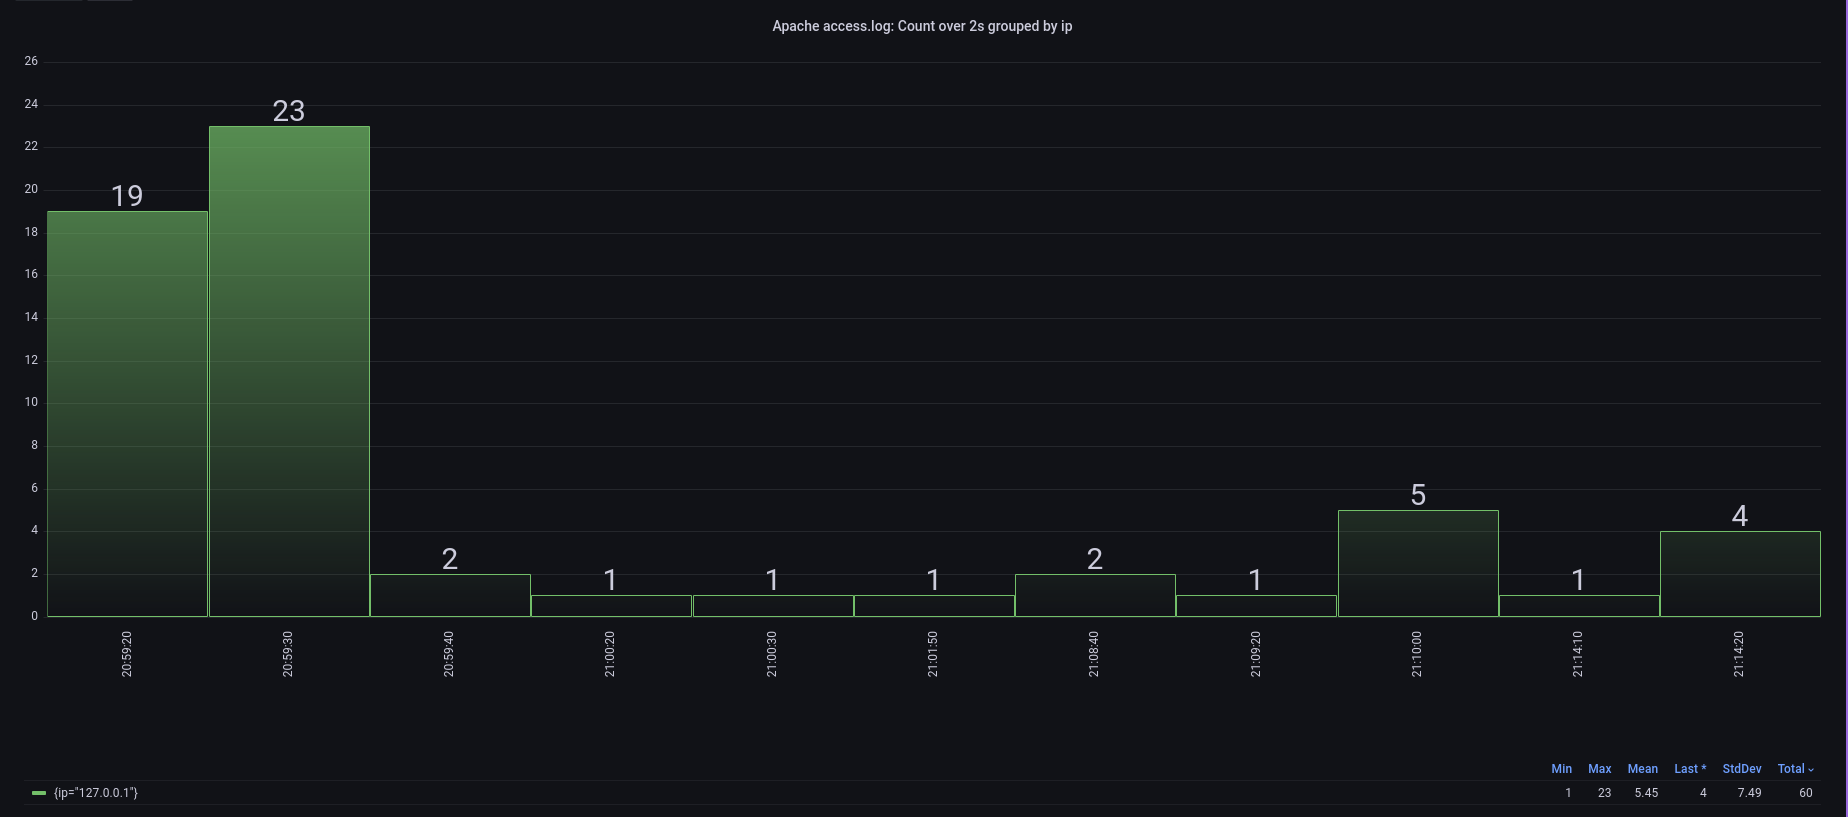
…and with this simple query and minimal work, I can count ip address occurrences from my apache access log (which is not very interesting in this case, but on a high traffic server it might be).
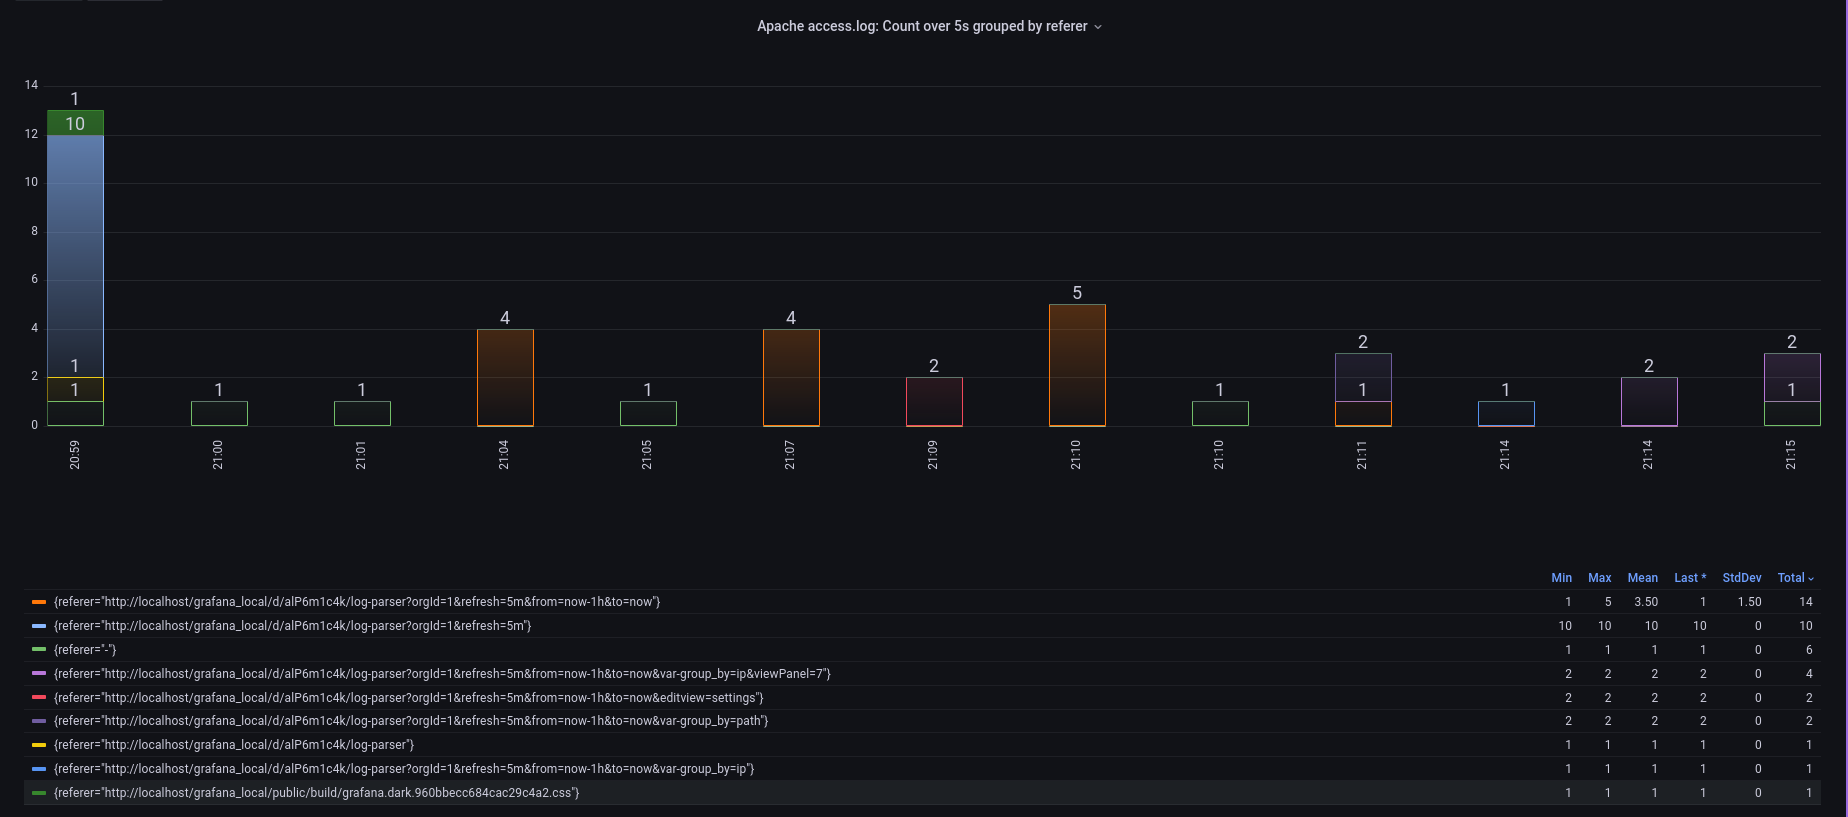
…or I can see what types of resources the visitors to the server are using…
Closing comments
The primary complications I have experienced to-date with Grafana Loki have been:
- Difficulties querying long term data (greater than one month is current default)
- The max_query_length: 0h found in the Loki config will override this behavior
- Struggling with overcomplicating the Promtail configuration
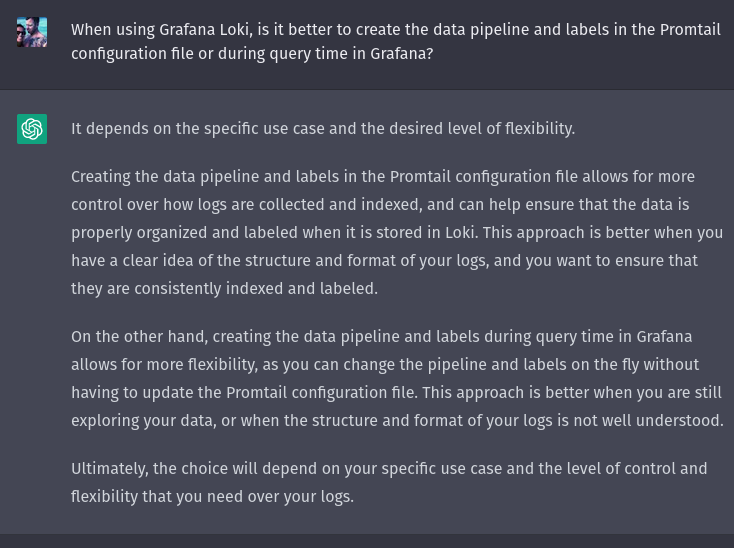
- I have opted to create the primary data transformation pipeline at query time rather than in the config
- Here is what ChatGPT says about the topic:
- The interval calculation is confusing when Grafana calculates the step interval for the Bar Chart Panel
- Resolution can also be toggled to varying ratios. For me, the behavior is not consistent and is unpredicatable
- Aggregating by 5m, does not necessarily generate a bar at 5m intervals
- I defaulted to using the Bar graph from the Time Series Panel and am not surprised by the results
- My aversion to the Bar Chart panel is most likely due to my own errors and ignorance
In summary, I am excited to bring Loki into my current observability stack at work as a new data source. I also know that I still have a lot to learn to take full advantage of Grafana Loki’s capabilities. I have promised to give a working example of extracting the log timestamp to use for analysis (rather than the time Promtail grep’d the log line) as a bonus. Please find a working config below that does just that:
Promtail config: timestamp extraction
Below is a working configuration file to extract and use the timestamp within the apache access log. Even if the timestamp being extracted does not exactly meet a specific standard (RFC3339, RFC822Z, etc..), you can use the reference date and time as shown below in the sample configuration to work around this inconvenience. Therefore, use January, 2nd of 2006, etc.. to define the custom format.
server:
  http_listen_port: 9080
  grpc_listen_port: 0

positions:
  filename: /tmp/positions.yaml

clients:
  - url: http://localhost:3100/loki/api/v1/push

scrape_configs:
- job_name: system
  static_configs:
  - targets:
      - localhost
    labels:
      job: varlogs
      __path__: /var/log/*log
- job_name: apache
  pipeline_stages:
  - match:
      selector: '{job="apache"}'
      action: keep
      stages:
      - regex:
          expression: "\\[(?P<timestamp>[\\w:/]+\\s[+\\-]\\d{4})\\]"
      - timestamp:
          source: timestamp
          format: "02/Jan/2006:15:04:05 -0700"
          location: "Europe/Paris"
  static_configs:
  - targets:
     - localhost
    labels:
      job: apache
      __path__: /var/log/apache2/access.log
..and that is all for now. If you made it this far, thank you for suffering through the post. Please let me know if you find a mistake in anything I have written.
There is no subject so old that something new cannot be said about it.
Fyodor Dostoevsky
Comments