
A simple use case for dbt and Airflow
My previous two posts involved installing a postgres server on a cheap, spare raspberry pi 3b+. The motivation was to save my time-series data for longer than 30-days since my free InfluxDB Cloud account, only has a 30-day retention policy.
I was successful in installing a fresh OS, configuring the rpi to run headless, scanning the local ip’s to find the rpi, ssh’ing to the single board computer, installing a PostgreSQL instance and finally writing a script to query my influxDB instance, transform the data and push the data to my postgresql database. I used a cronjob to execute the script with a comment about accomplishing the same task using Apache Airflow. So today, I am back to offload the scheduling from the cron daemon to Airflow and I am also throwing a dbt incremental materialization into the mix.
Motivation for added complexity
You might say that the cronjob was working just fine and if it isn’t broken, why fix it ![]() ? I
even commented during the writing that using Airflow felt like bird hunting with a scud missile.
Despite my comment, I have a simple and good reason to make use of Airflow.
? I
even commented during the writing that using Airflow felt like bird hunting with a scud missile.
Despite my comment, I have a simple and good reason to make use of Airflow.
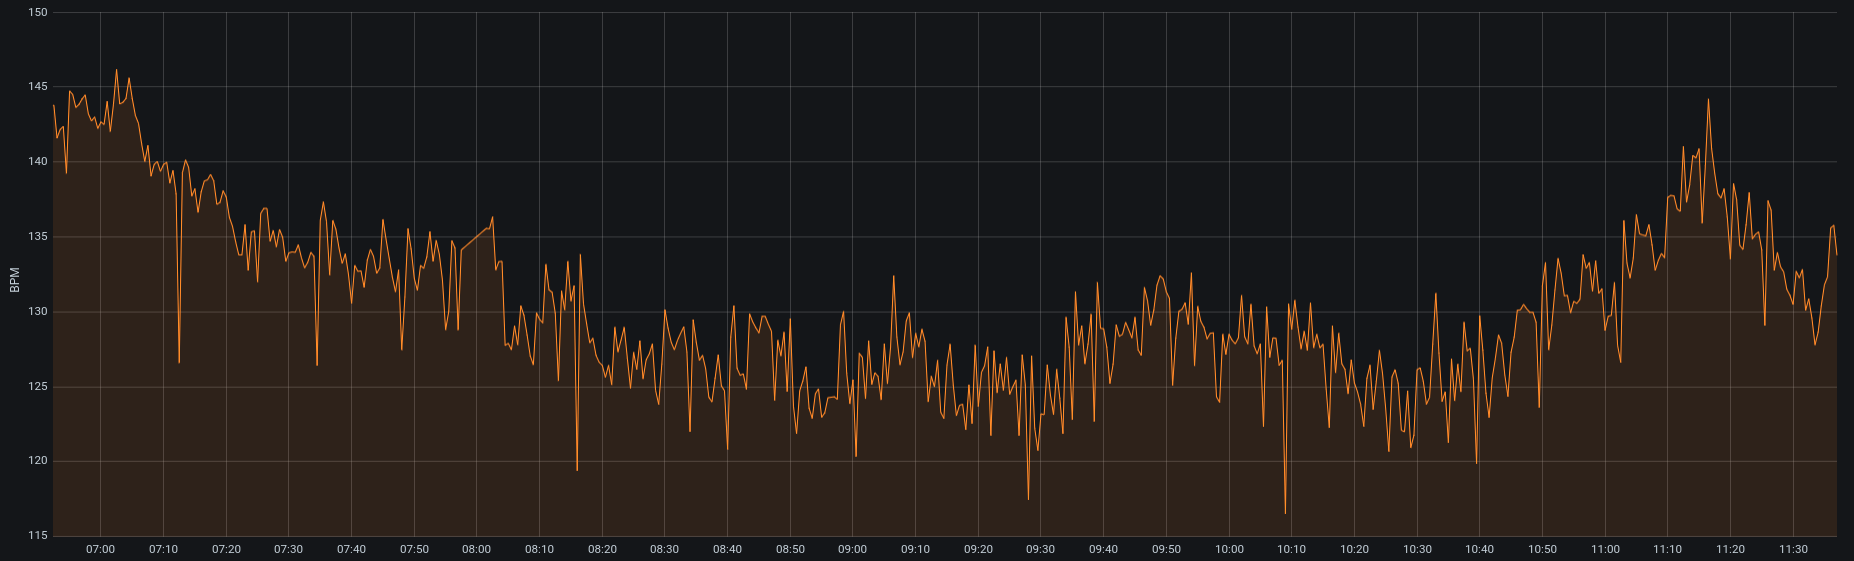
The pulse oximeter data I am collecting is very noisy. More so when my daughter moves, the sensor is not attached well or the sensor could even be defective. Whatever the case may be, outliers are not uncommon. Here is a screenshot to illustrate my point. The orange trace below represents the mean over a five second rolling window of my daughter’s heartrate. So, these data have already been “smoothed” slightly considering I capture her heartrate, specific oxygen and perfusion index all at a frequency of one sample per second.
I would like to smooth the signal even more using something simple like a moving average. This would allow me to more easily spot trends. Since I look at my daughter’s trends regularly, I need the data to be relatively up-to-date. I also take snapshots from my cloud database on an hourly basis, so it would be nice to calculate a moving average for my metrics of interest at the same time and frequency the updates occur. In this spirit, I decided to use dbt (Data Build Tool) to perform the transformation and materialization, and Airflow to ensure that this dbt model runs after and only after the data is loaded into postgresql from my cloud instance. So, let’s get started.
dbt: Install, init, model creation and test
I will not delve into all of the fine details of dbt, the documentation found online is excellent and I encourage you if you are interested in databases to check it out yourself. I will say that dbt will allow me to easily perform a transformation on data in my postgresql database using a simple query. After the transformation has been performed, dbt will handle the materialization for me.
dbt: Install and initialization
Dbt is a python module and can therefore be installed with pip. Using pip I installed dbt-postgres
on my rpi3b+: python3 -m pip install dbt-postgres. I specified PostgreSQL because I am
transforming data on a postgres server and dbt will need the postgres adapter to interact with the
database. Some other supported databases include: BigQuery, Redshift and Snowflake.
After the install was complete, I initialized a project called health_metrics:
$ dbt init health_metrics --adapter postgres
Running with dbt=0.20.0
Creating dbt configuration folder at /home/pi/.dbt
With sample profiles.yml for postgres

Your new dbt project "health_metrics" was created! If this is your first time
using dbt, you'll need to set up your profiles.yml file (we've created a sample
file for you to connect to postgres) -- this file will tell dbt how
to connect to your database. You can find this file by running:

  xdg-open /home/pi/.dbt

For more information on how to configure the profiles.yml file,
please consult the dbt documentation here:

  https://docs.getdbt.com/docs/configure-your-profile

One more thing:

Need help? Don't hesitate to reach out to us via GitHub issues or on Slack --
There's a link to our Slack group in the GitHub Readme. Happy modeling!
Next, I need to update the profiles.yml file as indicated by the message above
seen after initilizing my dbt project. Below shows my updated profiles.yml file
with the database password excluded:
default:
  outputs:

    dev:
      type: postgres
      threads: 1
      host: 192.168.0.12
      port: 5432
      user: soitgoes511
      pass: <PASSW_OF_DB>
      dbname: pulse_oximeter_historic
      schema: public

    prod:
      type: postgres
      threads: 1
      host: 192.168.0.12
      port: 5432
      user: soitgoes511
      pass: <PASSW_OF_DB>
      dbname: pulse_oximeter_historic
      schema: public

  target: dev
Once my profiles.yml configuration has been completed, I can save the file
and move on to writing the actual model.
dbt: Model creation and test
A model in it’s most basic form is an .sql file containing a single SQL
SELECT statement. Included in the same directory as the .sql file is a
file named schema.yml containing the model name, the column names being
returned by the SELECT statement, a brief description of each column and
test assertions which can be used to validate your model is performing the way
you expect it to. Further down the road, your model can be tested simply
by executing dbt test.
So, to the task at hand. I wanted to remove some noise and smooth my data and will start by calculating a simple moving average. My original data has been aggregated using the mean over a five second window before it is loaded into my postgresql database. This means I should have 12 samples per minute. I have been looking at pulse oximeter data for years now and feel confident that a five minute window will remove most of the noise without losing too much information. I can always adjust later, or revert back to my 5 second aggregated data. No harm, no foul. So, 12 samples per minute for 5 minutes equates to 60 data points (I need this for my query below).
One more point to cover before getting to the actual query/model. Dbt supports templating, macros, references, etc.. The possible materializations include a table, view, incremental and ephemeral. Table and View are hopefully self-explanatory. If not, please refer to the documentation link I referenced earlier in this writing. I will be using incremental. Incremental for the first execution will build a complete table. For later model runs, dbt will only build the new data onto the table assuming I have the is_incremental() macro wrapping my filters used to specify the new data. Again, the dbt folks do a much better job explaining this and that explanation can be found here.
Finally, here is the first iteration of my moving average model which will build
a table, incrementally (completely at first and can be rebuilt anew if
the --full-refresh flag is used at runtime):
{{ config(materialized='incremental') }}

SELECT
  time,
  spo2,
  AVG(spo2) OVER(
    ORDER BY
      time ROWS BETWEEN 59 PRECEDING
      AND CURRENT ROW
  ) AS ma_spo2,
  bpm,
  AVG(bpm) OVER(
    ORDER BY
      time ROWS BETWEEN 59 PRECEDING
      AND CURRENT ROW
  ) AS ma_bpm,
  perf_index,
  AVG(perf_index) OVER(
    ORDER BY
      time ROWS BETWEEN 59 PRECEDING
      AND CURRENT ROW
  ) AS ma_perf
FROM
  pox_five_second_mean

{% if is_incremental() %}
  WHERE time > (SELECT max(time) FROM {{ this }})
{% endif %}
The contents of my schema.yml:
version: 2

models:
    - name: pulse_ox_moving_average
      description: "5 minute moving average for spo2, bpm and perf"
      columns:
          - name: time
            description: "The primary key for this table"
            tests:
                - not_null
          - name: spo2
            description: "SPO2 sensor read aggregated by 5 minutes from time series"
            tests:
                - not_null
          - name: ma_spo2
            description: "5 Minute moving average of SPO2, previous 59 rows plus current"
            tests:
                - not_null
          - name: bpm
            description: "BPM sensor read aggregated by 5 minutes from time series"
            tests:
                - not_null
          - name: ma_bpm
            description: "5 Minute moving average of BPM, previous 59 rows plus current"
            tests:
                - not_null
          - name: perf_index
            description: "Perfusion Index sensor read aggregated by 5 minutes from time series"
            tests:
                - not_null
          - name: ma_perf
            description: "5 Minute moving average of Perfusion Index, previous 59 rows plus current"
            tests:
                - not_null
And finally, let me run the model and see what happens:
$ dbt run
Running with dbt=0.20.0
Found 1 model, 7 tests, 0 snapshots, 0 analyses, 147 macros, 0 operations, 0 seed files, 0 sources, 0 exposures

22:45:55 | Concurrency: 1 threads (target='dev')
22:45:55 |
22:45:55 | 1 of 1 START incremental model public.pulse_ox_moving_average........ [RUN]
22:45:56 | 1 of 1 OK created incremental model public.pulse_ox_moving_average... [INSERT 0 0 in 0.84s]
22:45:56 |
22:45:56 | Finished running 1 incremental model in 1.41s.

Completed successfully

Done. PASS=1 WARN=0 ERROR=0 SKIP=0 TOTAL=1
Notice the relatively fast time of execution. That is because I have run this model before and there is no new
data loaded to compute the moving average. The actual runtime is about 22 seconds, please bare in mind this is an
oldish rpi3b+ and not a supercomputer. Also note, that if I had specified a table for my materialization,
the entire table would have been rebuilt and this would have taken even longer than 22 seconds. If I were
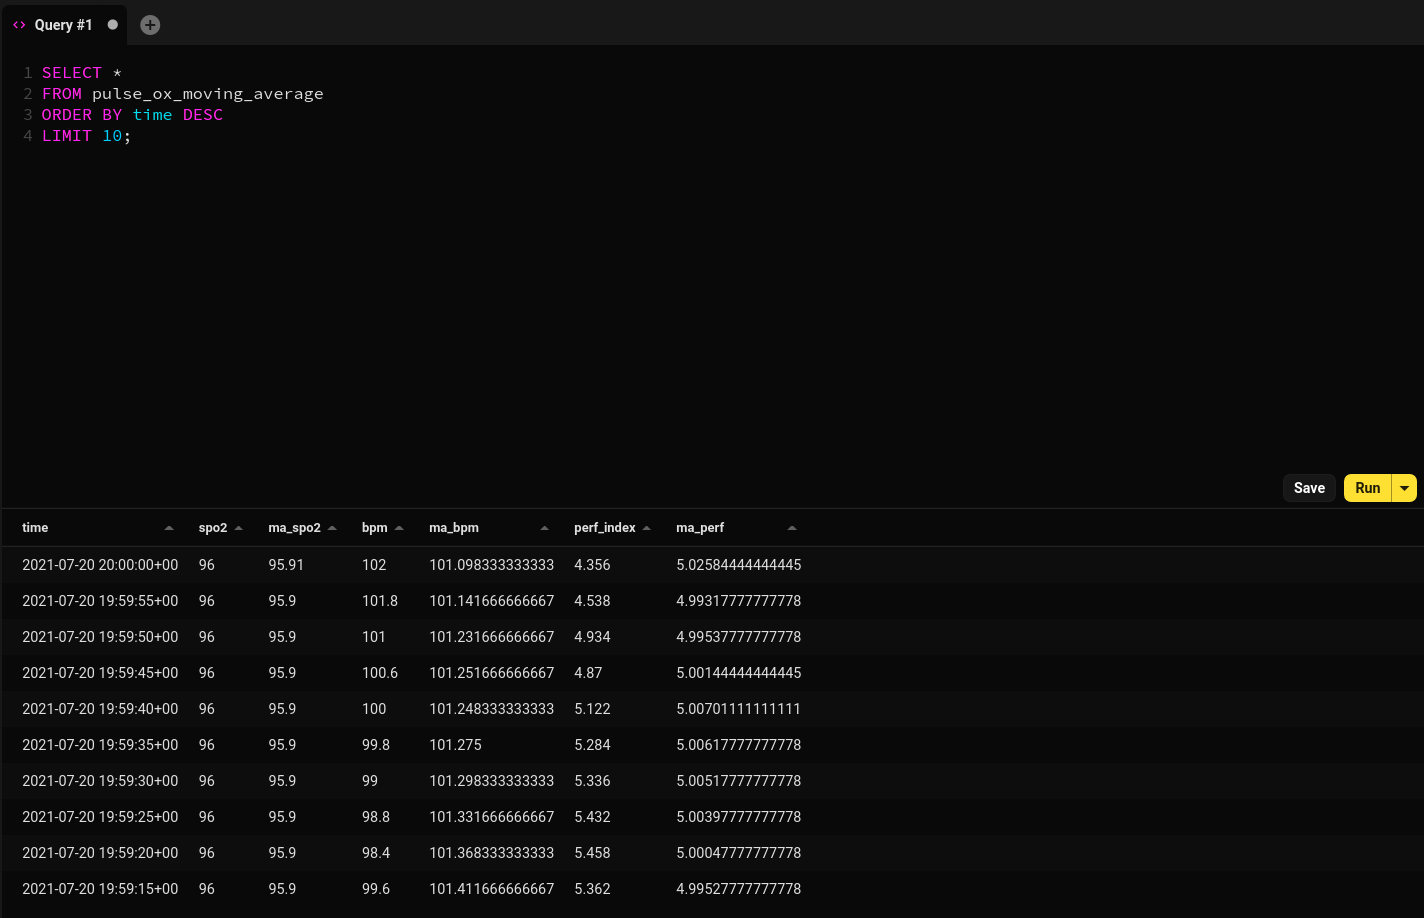
using a pay-per-use cloud provider, that would most likely equate to money down the drain ![]() . Here is a sample of the
result of my successful model materialization:
. Here is a sample of the
result of my successful model materialization:
Now that the model is working and has been tested, it is time to automate the model run at the top of each hour. Let’s move onto setting up Apache Airflow and creating a DAG (Directed Acyclic Graph).
Apache Airflow: Install, setup and DAG creation
Airflow was created by Maxime Beauchemin and used at Airbnb in 2014 to programmatically schedule tasks. Since that time, Airflow has become a part of the Apache Software Foundation.
I decided to change from my simplistic cron schedular to Airflow to ensure that the moving average is not
calculated until after the pulse oximeter data has been retrieved from my InfluxDB instance, shaped and
loaded into the PostgreSQL database server running on my raspberry pi. I could have handled this with
a cronjob in quite a few ways (e.g. Serializing the data extraction and loading with the moving average
calculation and table creation in the same script or simply by skewing the timing of two different
crons which is an error prone hack imho). While this is a simplistic use case, it still
solves my script execution timing issue in an elegant manner (with some added complexity). ![]()
Airflow: Install and setup
I used the following steps to install Airflow on my raspberry pi. Please be aware that these steps were taken directly from the Apache Airflow docs which can be found here. I have not altered nor improved these steps in any way and in no way am taking any credit for this:
# airflow needs a home, ~/airflow is the default,
# but you can lay foundation somewhere else if you prefer
# (optional)
export AIRFLOW_HOME=~/airflow

AIRFLOW_VERSION=2.1.2
PYTHON_VERSION="$(python --version | cut -d " " -f 2 | cut -d "." -f 1-2)"
# For example: 3.6
CONSTRAINT_URL="https://raw.githubusercontent.com/apache/airflow/constraints-${AIRFLOW_VERSION}/constraints-${PYTHON_VERSION}.txt"
# For example: https://raw.githubusercontent.com/apache/airflow/constraints-2.1.2/constraints-3.6.txt
pip install "apache-airflow==${AIRFLOW_VERSION}" --constraint "${CONSTRAINT_URL}"

# initialize the database
airflow db init

airflow users create \
    --username admin \
    --firstname Peter \
    --lastname Parker \
    --role Admin \
    --email spiderman@superhero.org

# start the web server, default port is 8080
airflow webserver --port 8080

# start the scheduler
# open a new terminal or else run webserver with ``-D`` option to run it as a daemon
airflow scheduler

# visit localhost:8080 in the browser and use the admin account you just
# created to login. Enable the example_bash_operator dag in the home page
After the installation is complete, I ensured to make all necessary changes
to airflow.cfg located at ~/airflow/ (which in my case was /home/pi/airflow/).
The primary setting I needed to know was where my DAGs where located. This setting
is dags_folder = /home/pi/airflow/dags in my case. This is where my DAG (.py files
will go). I also did not adjust the default_timezone. I used utc time as I did
for my PostgreSQL instance and as I would recommend anyone reading this should do.
Timezones have caused me some real headaches over the years and I find the best practice
to be, storing all data using UTC timestamps and then handling the timezones on the
application end if necessary.
Airflow: DAG creation
A DAG is a Directed Acyclic Graph as I have already mentioned. Put simply, it is a graph
who’s nodes are tasks. Those tasks are connected from one node to the next and the
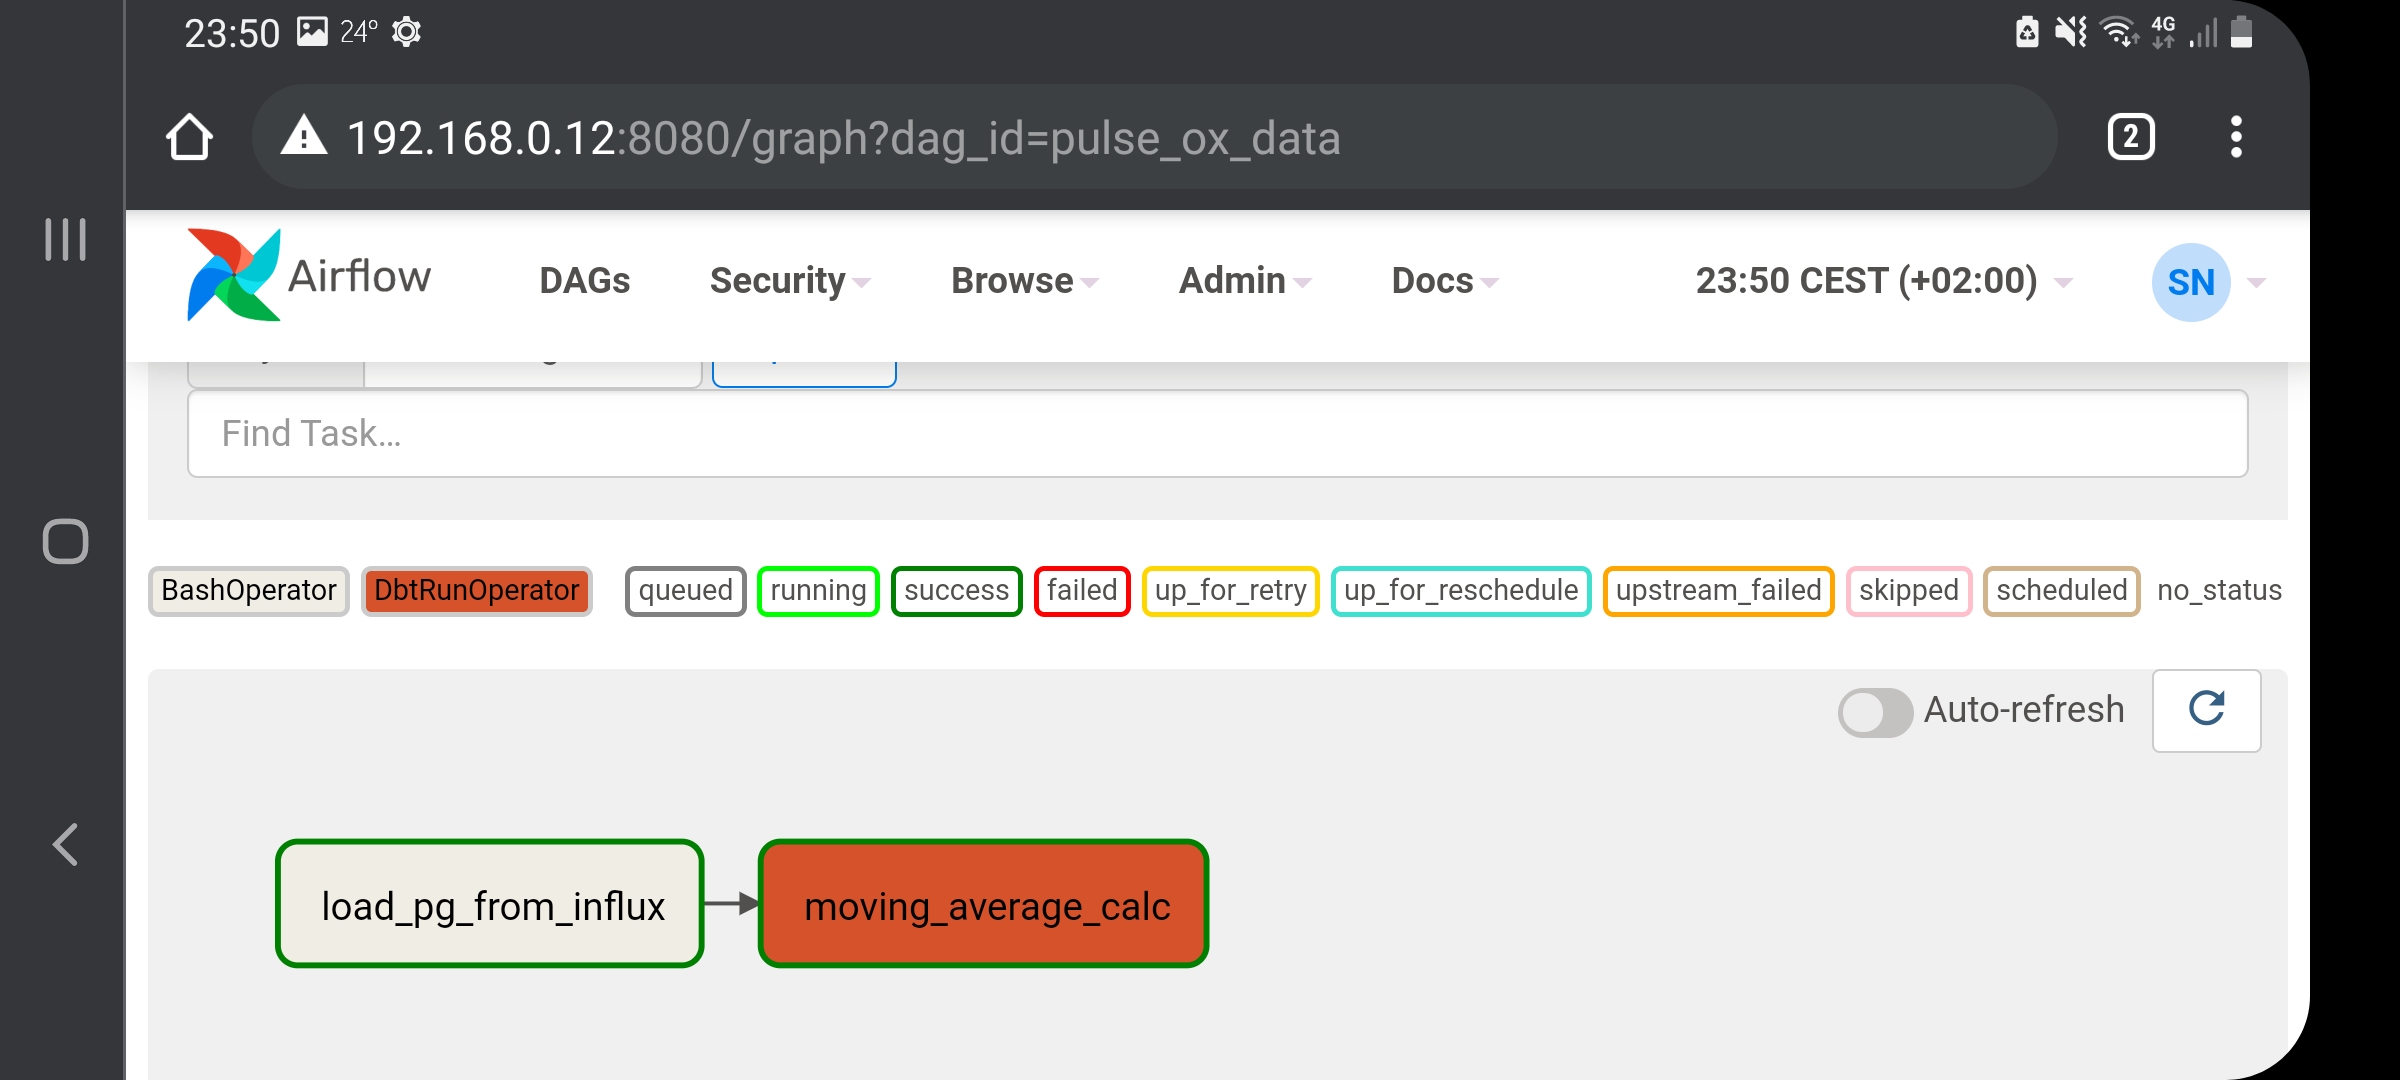
overall graph contains no closed loop. This screenshot of my DAG taken from the
Airflow webserver should clarify the Graph concept. My tasks are the nodes and the overall
graph is the name of my DAG. Notice there is directionality illustrated by an arrow pointing
from load_pg_from_influx ![]() moving_average_calc. Therefore, the moving average task will
be executed after the loading of data to postgres task is complete:
moving_average_calc. Therefore, the moving average task will
be executed after the loading of data to postgres task is complete:
Below is my DAG located in /home/pi/airflow/dags/. I used two operators for the two
different tasks:
- dbt_operator - (from pkg airflow-dbt in PyPi) which makes it easy to execute my dbt model
- BashOperator - which allows me to execute commands in Bash shell
I have set the schedule_interval to run at the top of each hour, every hour of every day. This
should be familiar to those that have scheduled a cronjob before… I can use the same syntax.
from airflow import DAG
from airflow_dbt.operators.dbt_operator import DbtRunOperator
from airflow.operators.bash import BashOperator
from airflow.utils.dates import days_ago
from datetime import timedelta

#
# The default dir contains my dbt models, the retries has been added
# to handle if the cloud provider is offline for maintenance (this happened).
# Finally, I allow 30 minutes to attempt a re-execution of the DAG
#
default_args = {
    'dir': '/home/pi/dbt_world/health_metrics',
    'start_date': days_ago(0),
    'retries': 1,
    'retry_delay': timedelta(minutes=30)
}

with DAG(dag_id='pulse_ox_data', default_args=default_args, schedule_interval='0 * * * *') as dag:

    influx_pg = BashOperator(
        task_id='load_pg_from_influx',
        bash_command='/usr/bin/python3 /home/pi/pg_loader/health_metrics_loader.py',
        dag=dag
    )

    dbt_run = DbtRunOperator(
        task_id='moving_average_calc',
    )

    influx_pg >> dbt_run
Please note the task variable influx_pg pipes into the dbt_run variable in the above script/DAG. This defines my graph directionality and order of execution. If I decide at some later point in time that I would like to materialize another view or table from the original influx_pg data, I can pipe into a list object (e.g. t1 » [t2, t3]). Like I said, what I have done so far is not very complex. Despite not being very complex, I was able to solve my scheduling dilemma in an elegant manner. If this were some critical data pipeline, I could send emails to myself or my team if my tasks fail. Airflow gives much more information and ability than a vanilla cronjob would to allow for troubleshooting efficiencies, bottlenecks or failures.
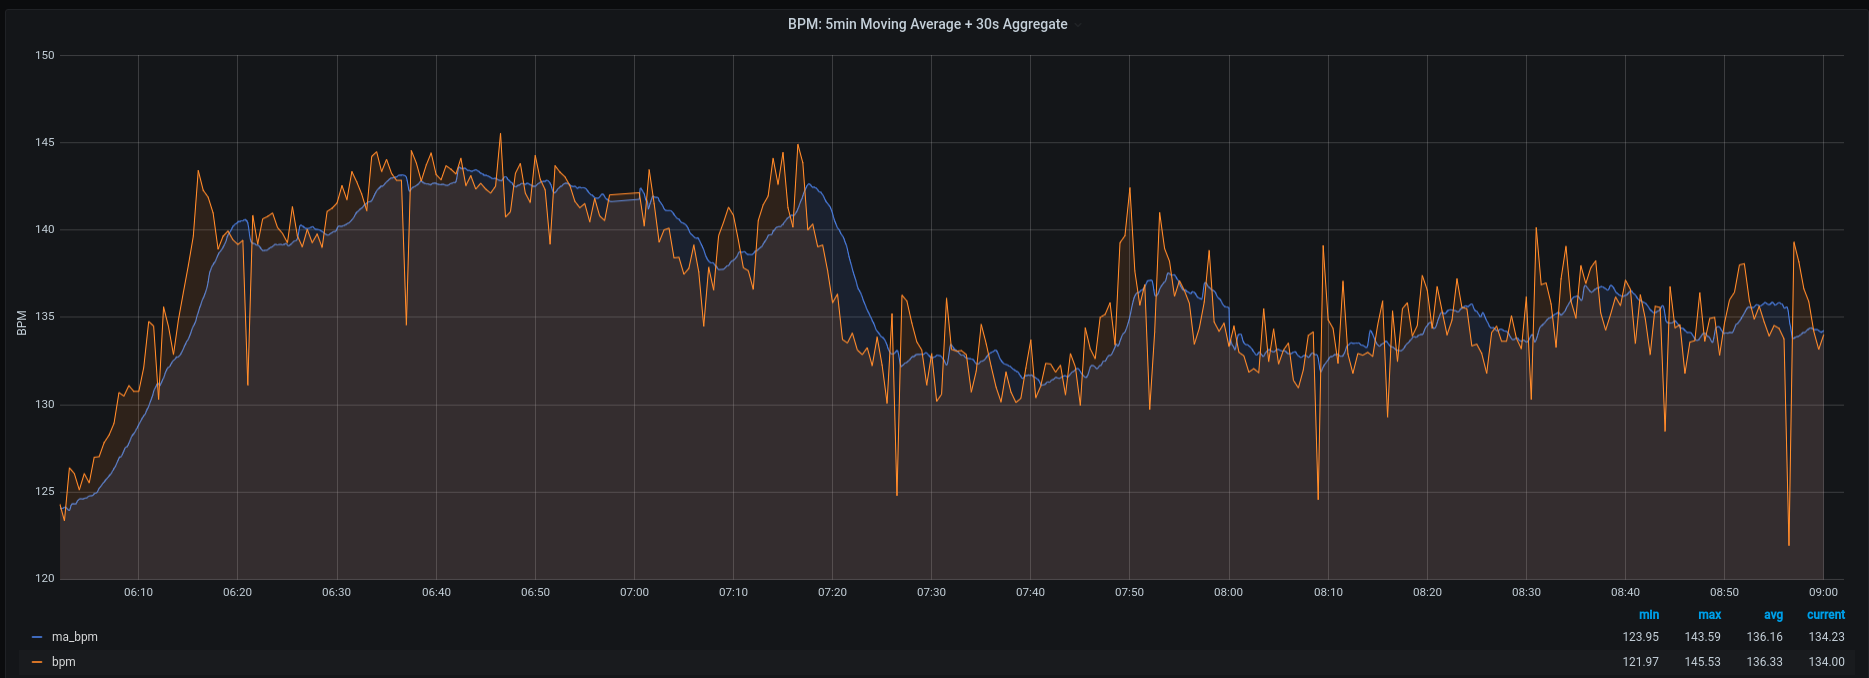
Last but not least, here is a screenshot of the resulting moving average (blue) for my daughter’s heartrate overlayed onto the original heartrate data stored in my PostgreSQL database (orange):
If someone reads this and spots an obvious mistake or has some additional insights or questions, please send me an email.
“I don’t know what is behind the curtain; only that I need to find out.” ― Richard Paul Evans, Lost December
Comments